For a small web app, JavaScript error tracking comes down to four things: catch every uncaught error and unhandled promise rejection, group the repeats so a hundred crashes read as one bug, turn minified stack traces back into your own code, and keep the console and network activity from the minute before. Dashboards, alert rules and performance tracing can wait until someone's job is to watch them.
This post goes through the four, the browser details behind each, and the noise you can throw away. We just shipped error capture in BugDump, so the examples come from it, but the mechanics are the same whichever tool you pick.
Your users won't tell you
When a checkout button does nothing, most people try again, sigh, and leave. A few write in, usually days later, with a description like "it's broken on my phone". The error was there the whole time, in a console nobody was looking at.
That's the case for error tracking in one sentence: it turns the bugs nobody reports into a list you can work through. For a small app, the list matters more than any chart drawn on top of it.
1. Catching errors: two events
Browsers report failures through two events, and you need both:
window.addEventListener('error', (event) => {
  report(event.error ?? new Error(event.message));
});

window.addEventListener('unhandledrejection', (event) => {
  report(event.reason);
});
error fires for an exception nothing caught: a typo, a property read on undefined, a call to a function that doesn't exist. unhandledrejection fires for a promise that failed with nobody listening. In code that's mostly async and await, that second event is where most errors end up. A fetch that gets an HTML error page and calls response.json() on it never touches window.onerror.
Three things these events won't give you:
Errors you catch yourself. A
try/catchthat shows a friendly message also hides the error from both events. If you still want to know about it, report it from thecatchblock.The details of errors from other origins. A script from another domain, loaded without CORS, fails as
Script error.with no file, line or stack. The browser hides it on purpose. Load the script withcrossorigin="anonymous"and serve it with anAccess-Control-Allow-Originheader, or accept that you can't see inside it.Errors before your tracker loads. If the tracking script loads last, the crashes during startup are gone. Load it early.
The listeners are the easy part. The rest of this post is about what happens after report().
2. Grouping: a thousand events, one bug
An error that hits every visitor on a page arrives thousands of times. You want one row with a count, so grouping decides whether the list is usable at all.
The usual approach, and the one we use, builds a fingerprint from three parts:
the error type, such as
TypeError;the message with its variable parts taken out:
Order 58213 not foundandOrder 61007 not foundare the same error, so numbers, URLs, emails and IDs become placeholders;the top few frames of your own code, by file and function rather than line, so an unrelated edit higher up the file doesn't split the group.
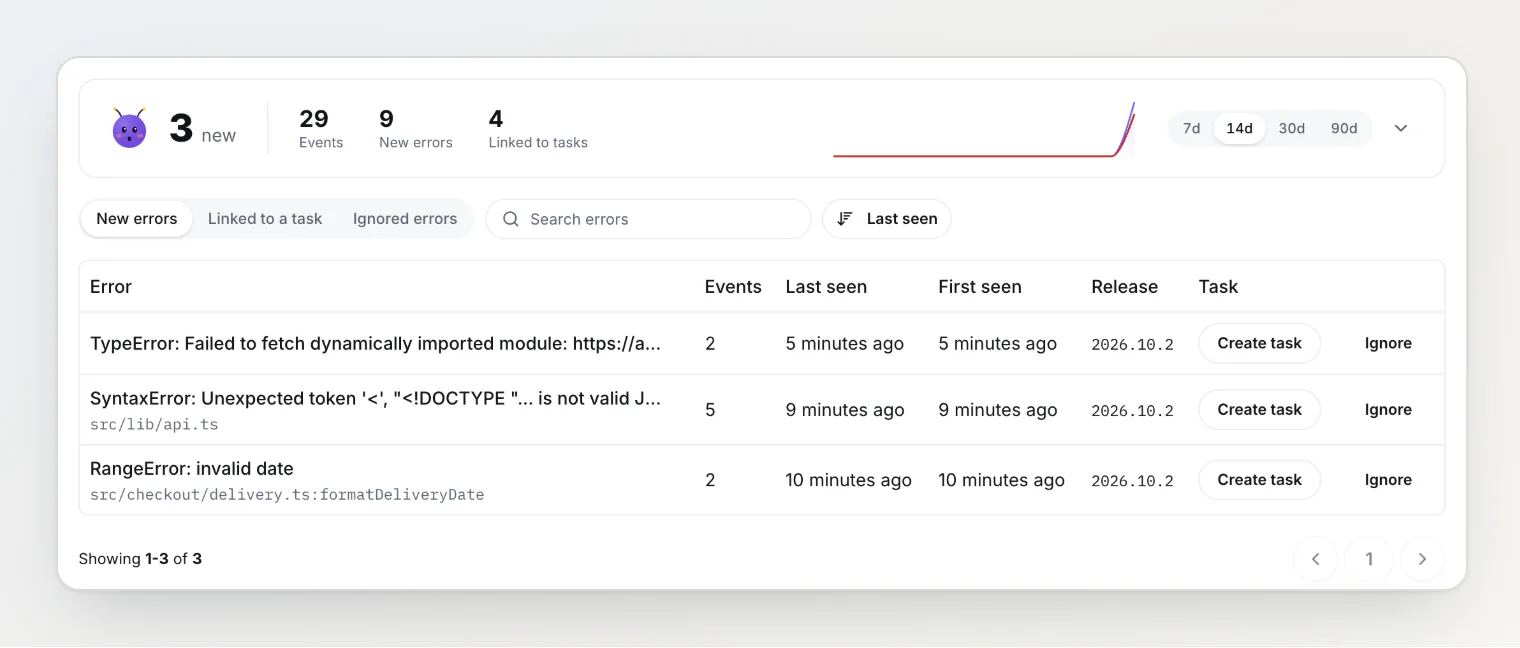
It's good, not perfect. Browsers word the same failure differently: Chrome says Cannot read properties of undefined (reading 'total'), Safari says undefined is not an object (evaluating 'cart.summary.total'). They build stacks differently too; Firefox adds a frame for the place a callback was registered. So now and then one bug arrives as two errors, one per browser. A tool should let you attach both to the same task and move on, instead of pretending it never happens.
3. Noise: what to throw away first
Some errors aren't yours, and some aren't really errors. Drop them before they reach your list, or the list stops being worth reading.
What you see | Why it happens | What to do |
|---|---|---|
| a script from another origin, hidden by the browser | drop it, or add |
a frame in | a browser extension injected code into your page | drop it |
| a harmless layout loop the browser warns about | drop it |
| an ad blocker removed an analytics script your code still calls | ignore it, or guard the call |
| a request your own code cancelled | ignore it |
Two more rules keep the volume sane without losing anything:
Send each distinct error once per session. A crash inside a render loop can fire hundreds of times a second in one tab. The first one tells you everything.
Cap the rate per page. Ten a minute is plenty for one tab. Anything above that is a loop, not new information.
Sampling, sending only a share of errors, helps once traffic is big enough that 10 % of it still finds every bug. On a small app it mostly hides the rare error you most needed to see. Leave it at 100 % until the monthly count says otherwise.
4. Readable stack traces without publishing your source
Production code is minified, so a raw stack trace reads like this:
TypeError: Cannot read properties of undefined (reading 'subtotal')
    at T (https://acme-store.com/assets/app-L5L4OHQM.js:2:1095)
    at x (https://acme-store.com/assets/app-L5L4OHQM.js:2:2081)
A source map turns that back into renderCartSummary in src/cart/cart-summary.ts, line 6. The catch is where the maps live. Serving them next to your JavaScript works for DevTools, and it also publishes your source to anyone who opens the network tab.
The better pattern is hidden source maps. The bundler writes the .map files without pointing your JavaScript at them, your CI uploads them to the error tracker, and they never reach your server.
The tracker then has to find the right map for each frame. Matching by file URL and release name is the old way, and it breaks easily: a CDN changes the URL, a release name doesn't match, two builds share a name. The more reliable way, which Sentry moved to and we use too, is a debug ID. A step after the build computes an ID from each file's content and stamps it into the file and into its map. At runtime the file registers its ID, the error carries it, and the map is found by ID alone.
In practice it's three commands:
vite build --sourcemap hidden
npx @bugdump/cli sourcemaps inject dist
npx @bugdump/cli sourcemaps upload dist --release "$GIT_SHA" --delete-after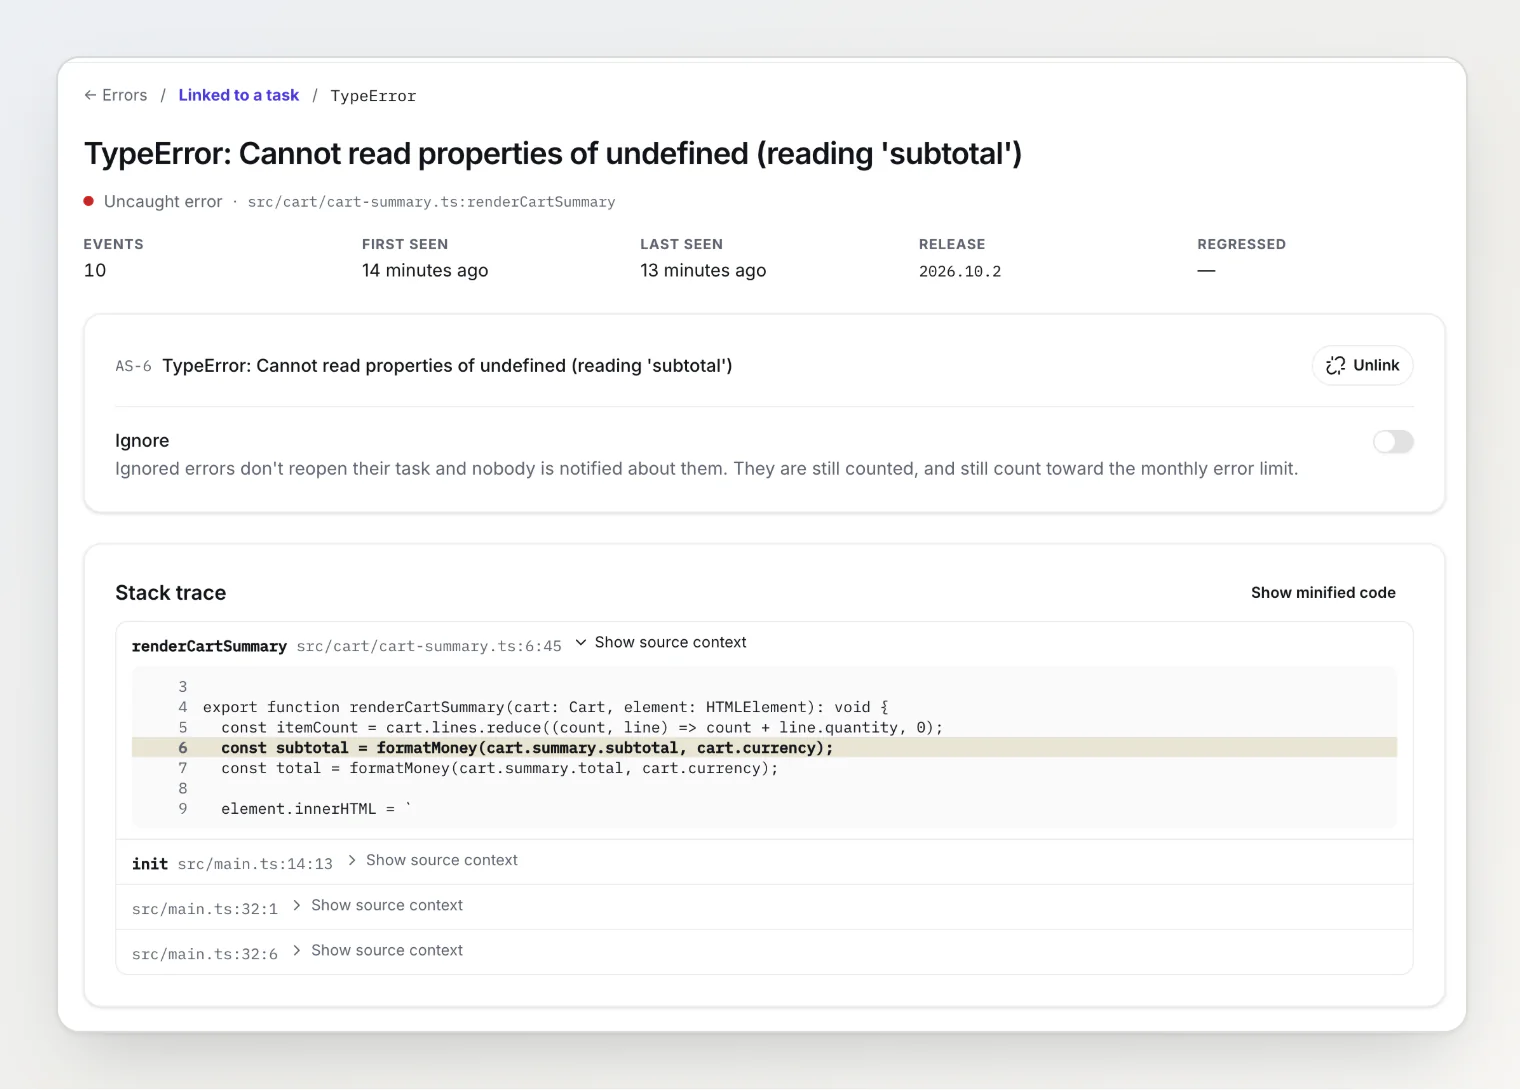
5. The minute before the error
A stack trace tells you where the code gave up. It often doesn't tell you why.
Here is an example from our demo store. The error is SyntaxError: Unexpected token '<', "<!DOCTYPE "... is not valid JSON, thrown inside a small getJson() helper. The stack points at JSON.parse, which is correct and no help at all. The network log from the same event explains it: GET /api/recommendations came back as a 502 page from the load balancer, and the code tried to parse the HTML as JSON.
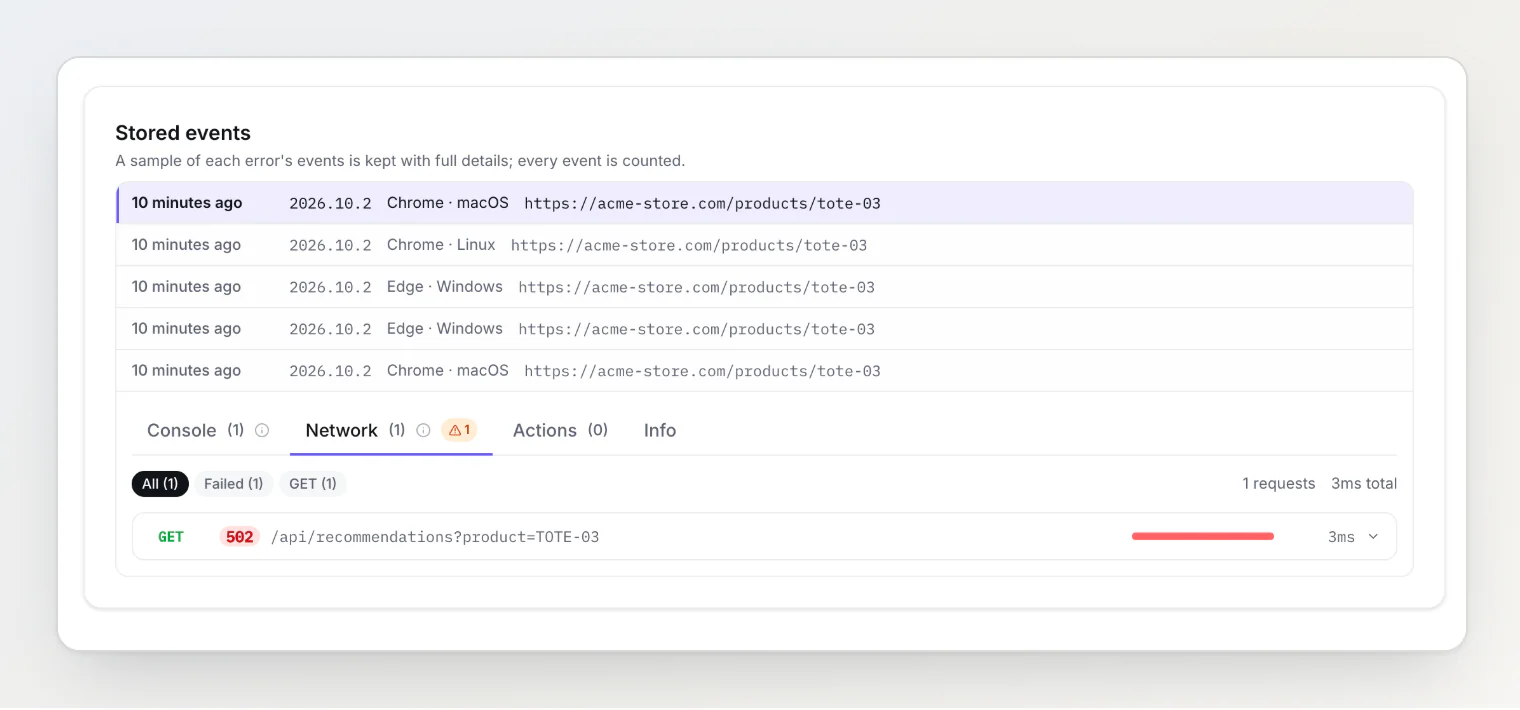
That's why an error event should carry the last minute of console logs, network requests and clicks, the same evidence a good bug report has. Without it, half your errors end up as "can't reproduce".
The other half of the context is your users. In the same demo store, task AS-1 was written from customer complaints: "Checkout button does nothing on Safari". On its own, that's the classic report nobody can act on. On the same task now sits the captured error, seen four times, only in Safari and Mobile Safari: window.requestIdleCallback is not a function. Safari has no requestIdleCallback, so the click handler throws before the order is ever sent. What the customers saw and the line that explains it are on one card.
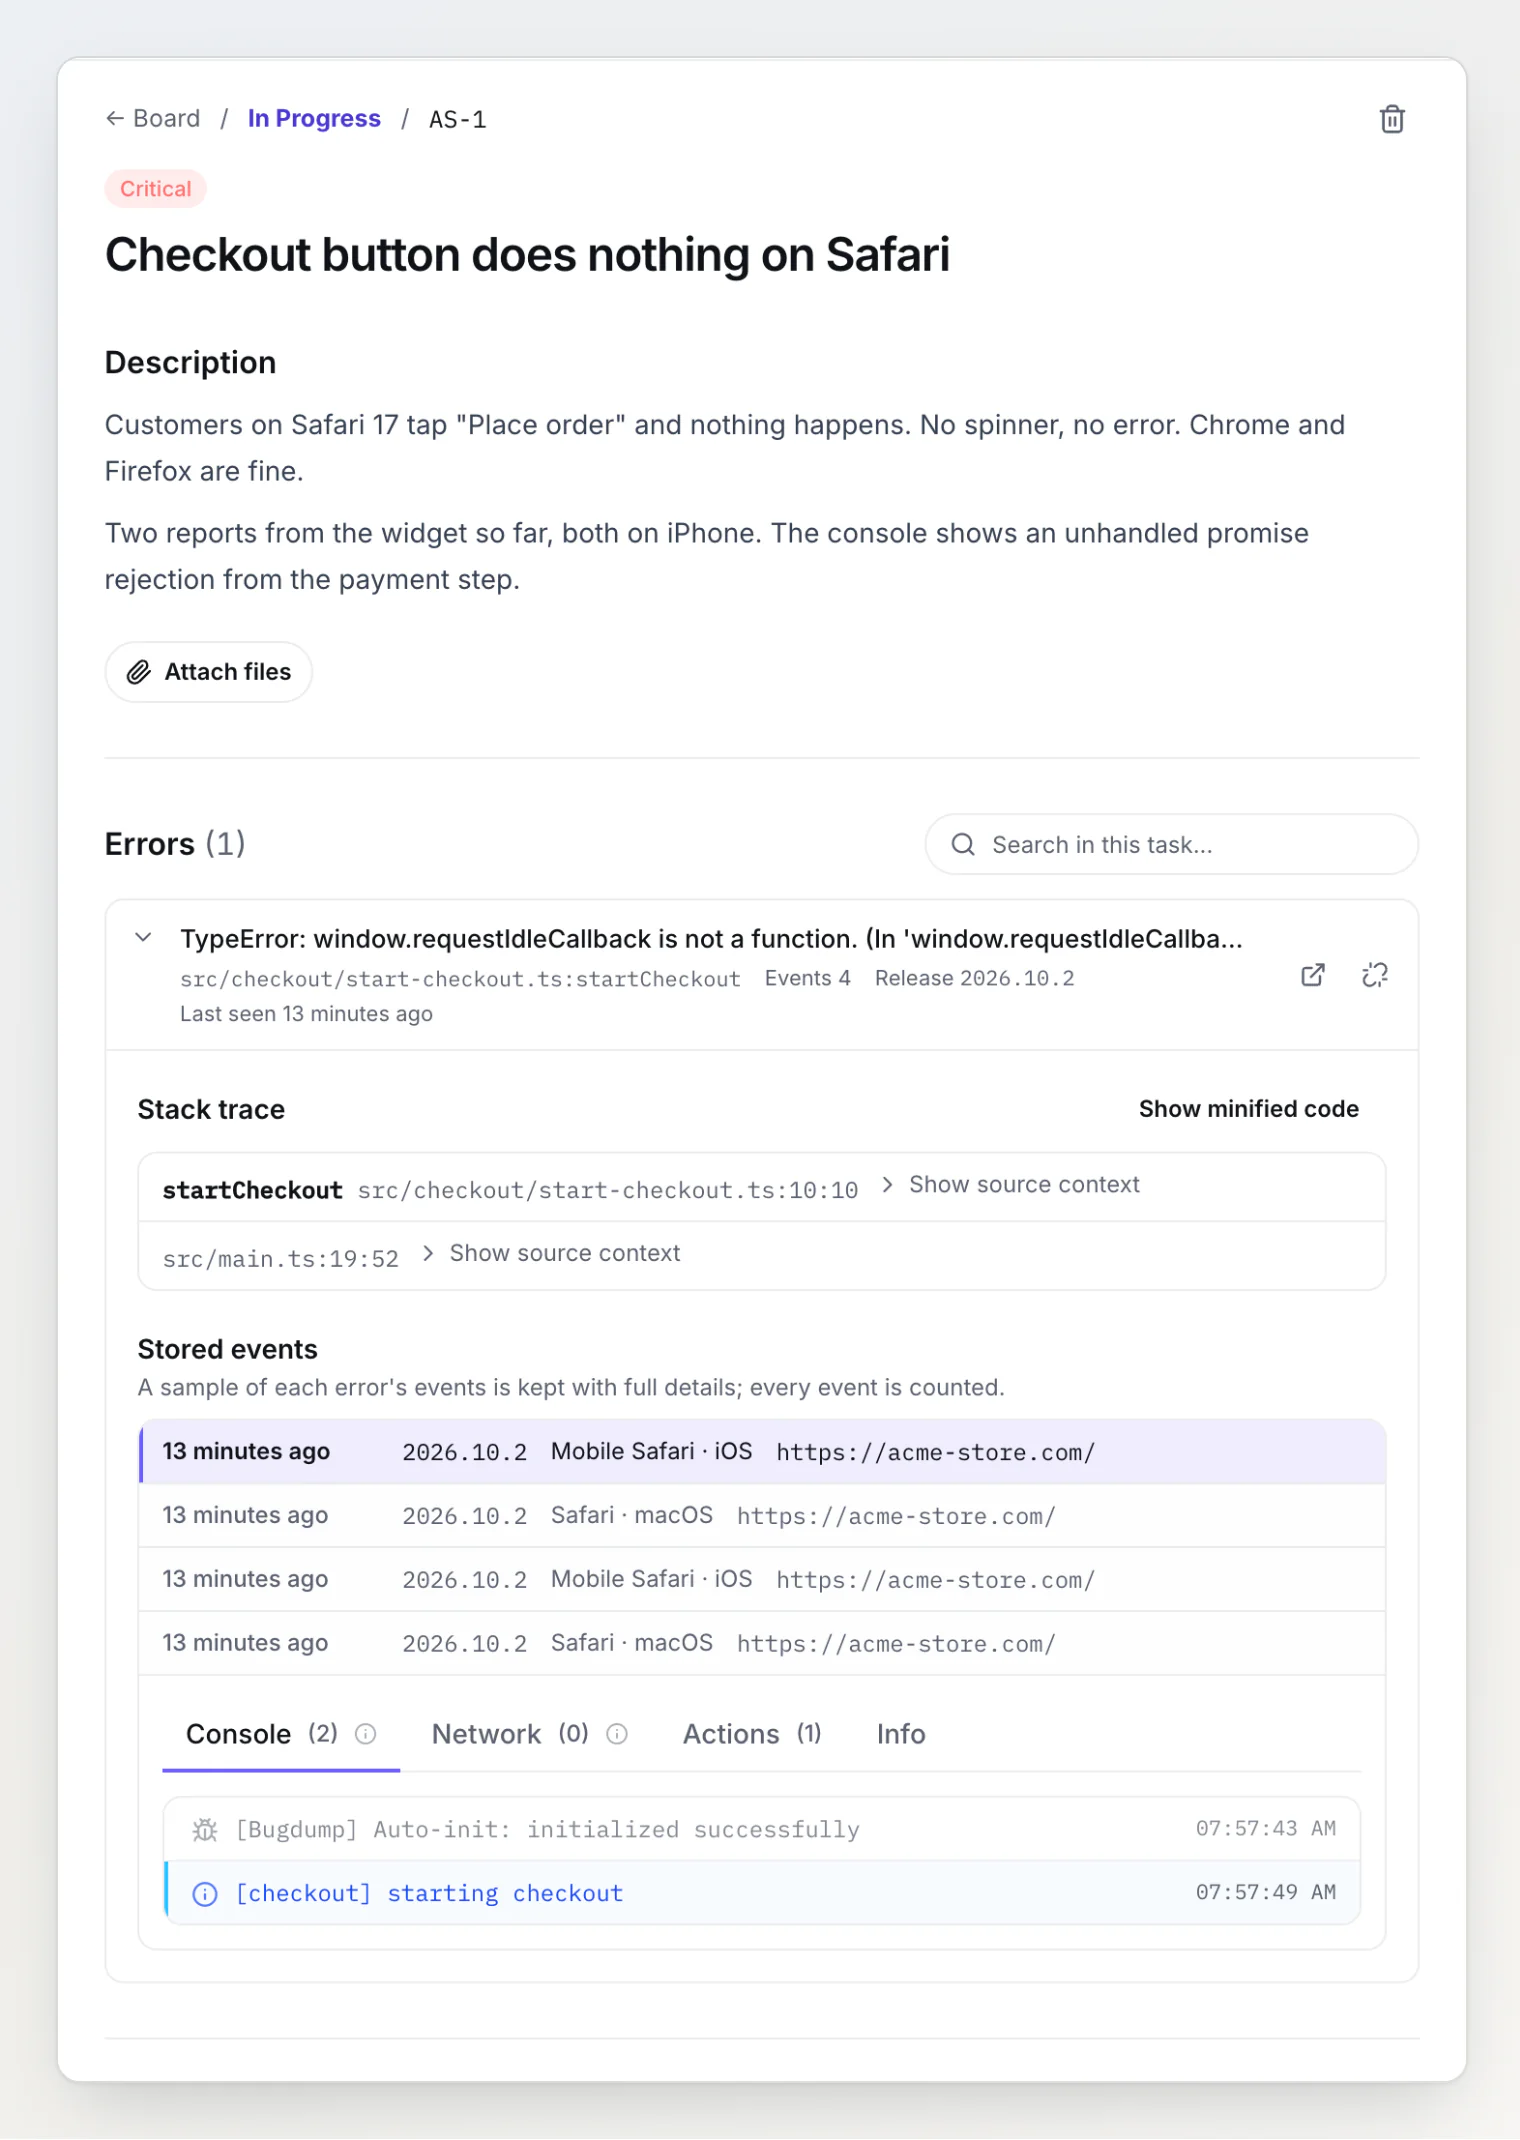
This is the part a separate error dashboard misses. The bug a user describes and the error the code throws are often the same bug, and they belong in the same place.
Do you need a full monitoring tool?
Not always. Dedicated error monitoring products do much more than catch browser errors, and if you need what they add, use one. For a small app, the honest comparison looks like this:
Error capture in your bug tracker | A dedicated monitoring tool | |
|---|---|---|
What it catches | JavaScript errors and rejections in the browser | browser, server and mobile errors, plus performance |
Where errors go | the same board as your users' bug reports | a separate inbox, linked out to your tracker |
Setup | the widget you already have | a second SDK, project and set of alerts |
Alerts | a notification for new and returning errors | rules, thresholds and on-call routing |
Good fit | small web apps, a few developers | teams with on-call, several services and SLOs |
If your app is one frontend and an API, and the same two or three people read the bug reports and fix the errors, one board is less to set up and less to check. Once you have a backend to monitor, an on-call rotation or a performance budget, a dedicated tool earns its place.
A checklist for a small app
Listen for both
errorandunhandledrejection, and load the tracker early.Report the errors you catch yourself, when you still care about them.
Set a
releaseon every build, so you can tell a new bug from an old tab.Build with hidden source maps and upload them from CI. Never deploy the maps.
Drop extension errors,
Script error.and harmless browser warnings at the source.Send each error once per session, and leave sampling off until volume demands it.
Turn errors into tasks next to your bug reports, not into a second inbox nobody opens.
FAQ
Does error tracking slow my site down? Not in any way you'd measure. The two listeners do nothing until something fails, and a reasonable tracker sends each distinct error once per session, in the background.
What does "Script error." mean? An error happened in a script from another origin and the browser hid the details. Add crossorigin="anonymous" to that script tag and have its server send Access-Control-Allow-Origin, or drop these errors: without details there is nothing to act on.
Is it safe to upload source maps? Uploading them to your error tracker is fine. Serving them publicly is what exposes your source. Build hidden maps, upload them, and delete them before the deploy.
How many errors will a small app send? That depends far more on how many distinct bugs you have than on traffic. With each error sent once per session, a page with one bug sends one event per affected visit, not one per crash.
Trying it in BugDump
Error capture is part of the BugDump widget, on every plan, and it's on by default. The Free plan includes 1,000 error events a month per project. Start with Capturing JavaScript errors automatically, then Readable stack traces: uploading source maps and Working with captured errors.
Read next: Session Replay for Debugging: See What Users Did Before the Bug and Lightweight Bug Tracking for Small Teams: When Jira Is Too Much.