This guide takes you from an empty project to a received bug report.
1. Create a project
In the dashboard, create a project. BugDump creates the project's first widget key with it and takes you straight to the project's Widget page, where the snippet is already filled in with that key.
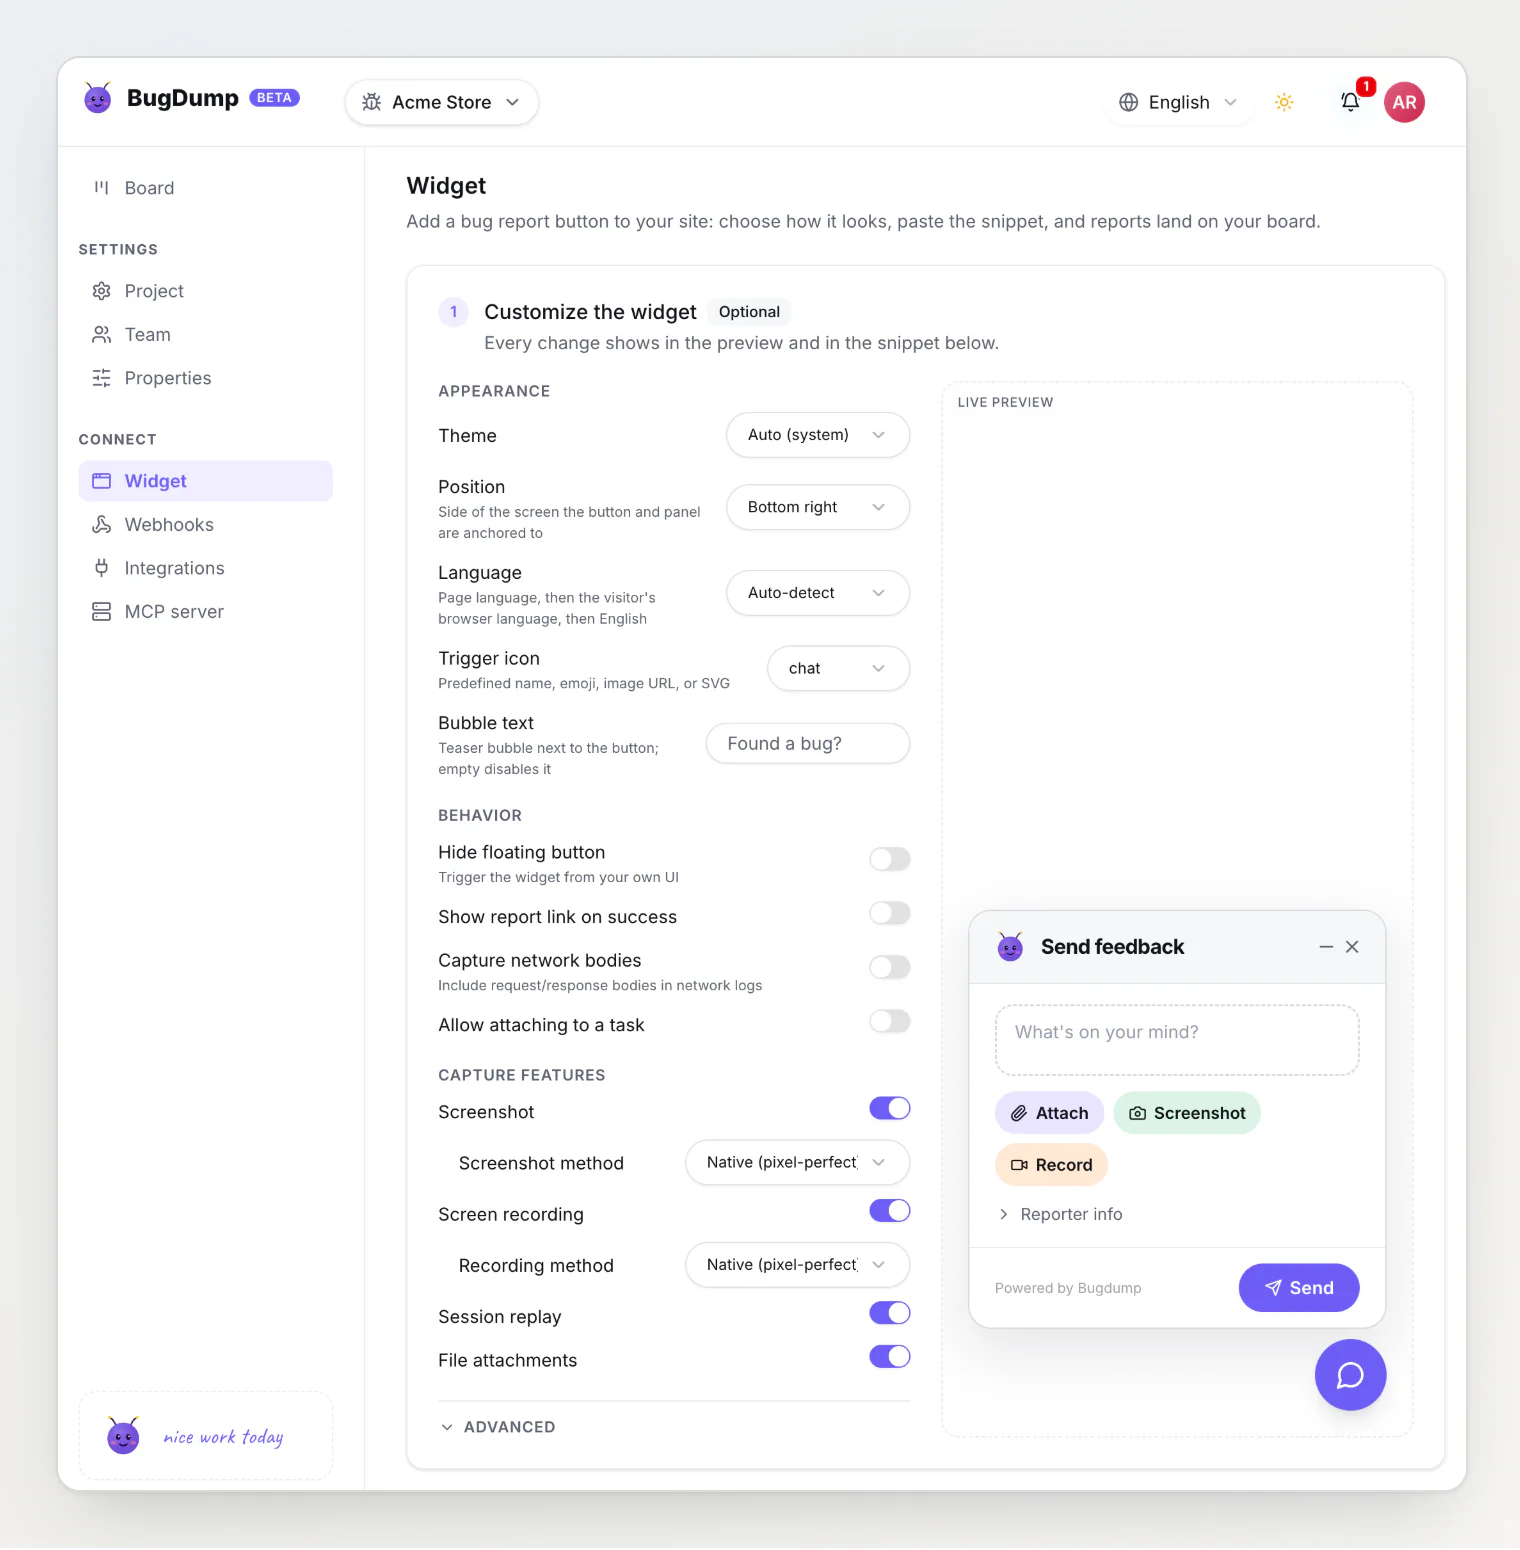
The page walks through four steps: customize the widget (optional — every change shows in the live preview and in the snippet), add it to your site, optionally restrict which sites may send reports, and check the connection. You can come back to it any time from Widget in the project sidebar.
Widget keys are meant to be public — they live in your frontend where anyone can read them. They can submit reports and nothing else. They cannot read your existing reports. Never put an MCP token (it starts with bdm_) in frontend code.
2. Add the widget
Step 2 of the Widget page shows the snippets below with your key already in them, ready to copy.
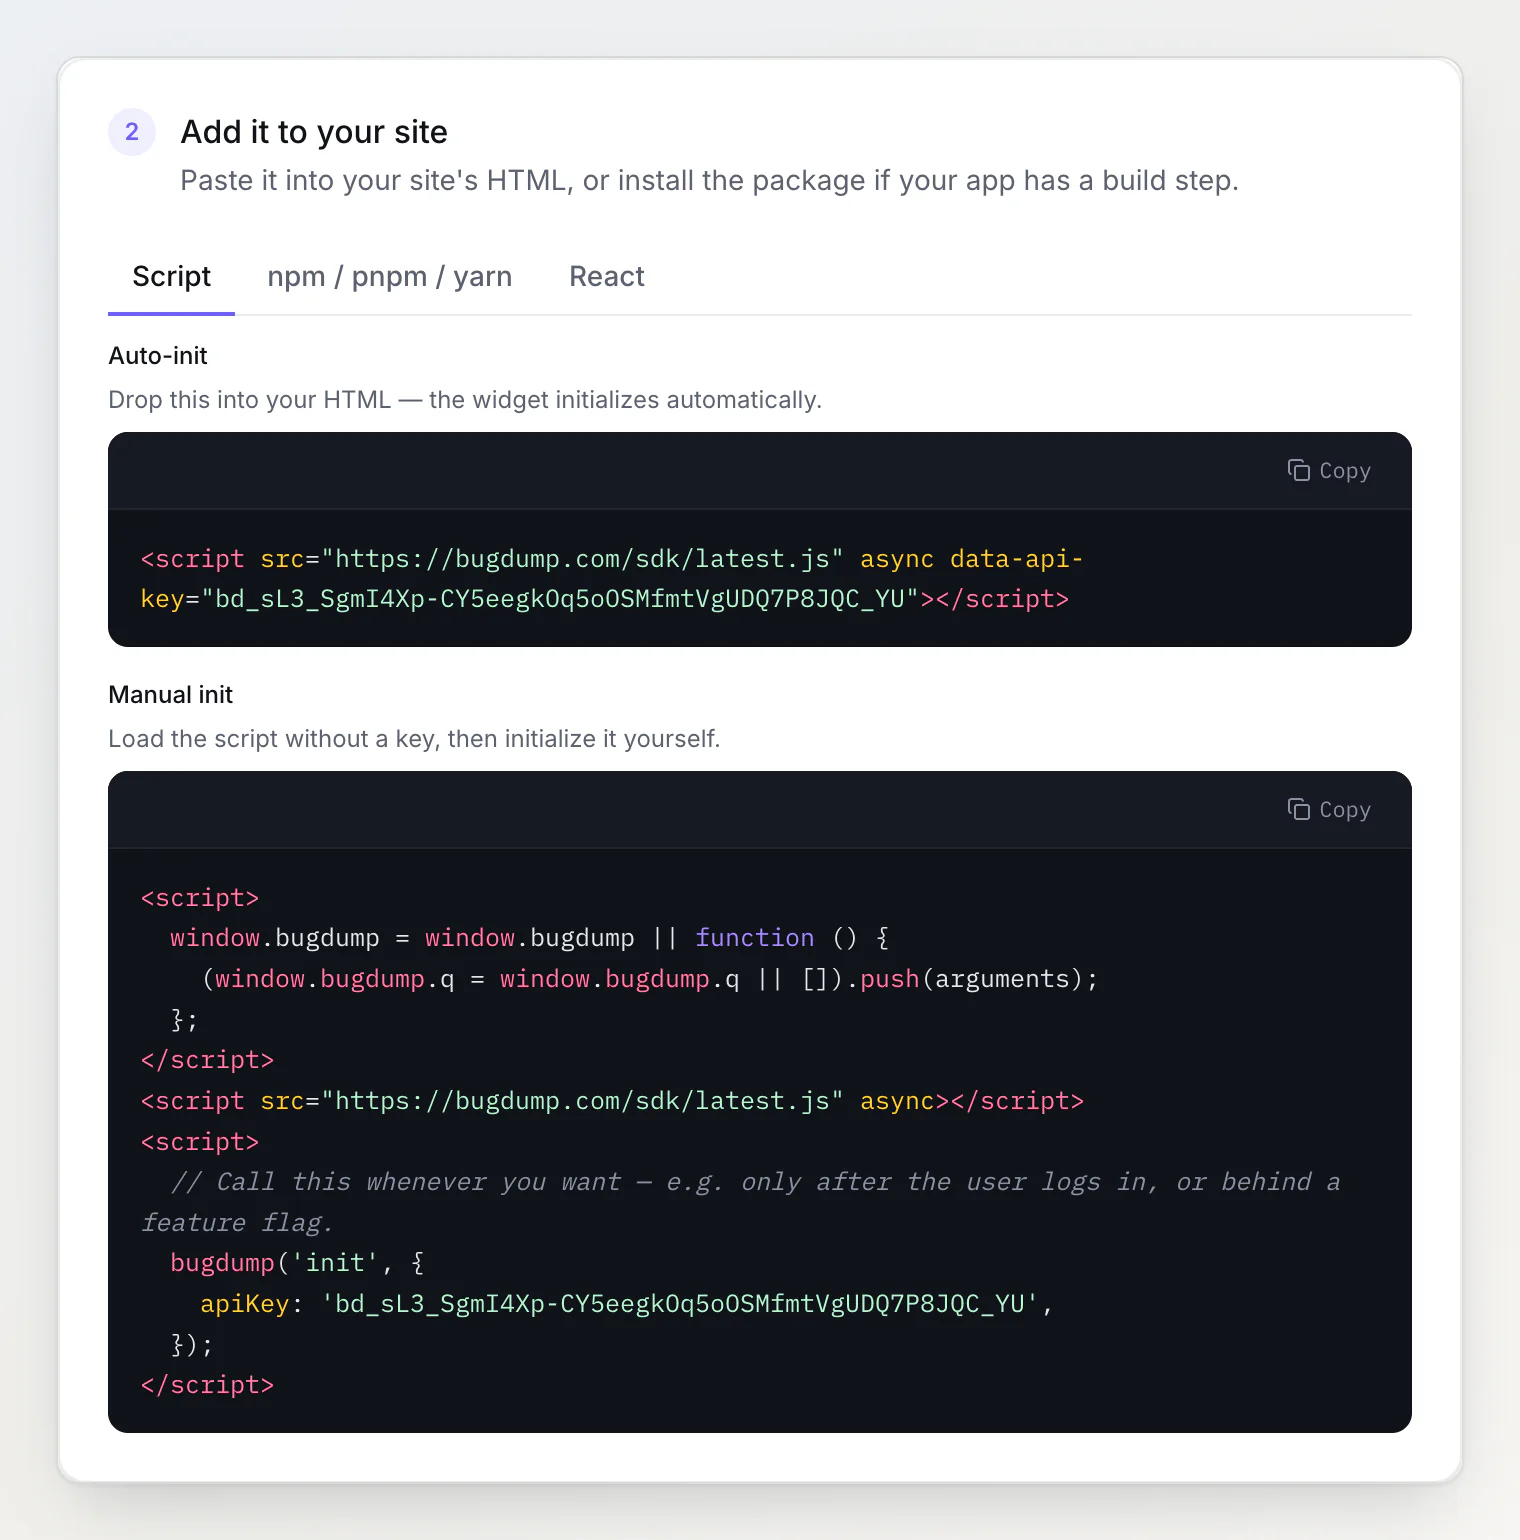
Script tag (recommended)
Paste one line before your closing </body> tag:
<script src="https://bugdump.com/sdk/latest.js" async data-api-key="your-api-key"></script>The data-api-key attribute triggers auto-init. A floating report button appears — no JavaScript of your own required.
Keep the async attribute. Without it the browser stops parsing your page to download the SDK, and holds back DOMContentLoaded until it has run — so a third-party widget ends up gating your own app's startup. With async the download happens alongside everything else and the widget initializes as soon as it arrives.
npm
npm install @bugdump/sdkimport { Bugdump } from '@bugdump/sdk';
const bugdump = Bugdump.init({
apiKey: 'your-api-key',
});React and Next.js
npm install @bugdump/react @bugdump/sdkimport { BugdumpProvider } from '@bugdump/react';
<BugdumpProvider config={{ apiKey: 'your-api-key' }}>
<App />
</BugdumpProvider>;The React tab in step 2 has this block with your key in it. Adding BugDump to a React or Next.js app covers the hook and the error boundary.
Script tag without auto-init
Omit data-api-key and call init yourself when you want to control the timing:
<script>
  window.bugdump = window.bugdump || function () {
    (window.bugdump.q = window.bugdump.q || []).push(arguments);
  };
</script>
<script src="https://bugdump.com/sdk/latest.js" async></script>
<script>
  bugdump('init', { apiKey: 'your-api-key' });
</script>
The three-line stub makes bugdump(...) safe to call immediately: until the SDK arrives it queues calls, and when the script loads the SDK replays them in order and takes over the function — so the same calls work before and after load. Without the stub, an inline Bugdump.init() would race the async download and usually throw Bugdump is not defined.
The command form covers the rest of the API too — bugdump('identify', {...}), bugdump('open'), bugdump('setContext', {...}) — callable at any point in the page's life. Methods that return a value (like collectTelemetry()) are not available as commands; call those on window.Bugdump.getInstance() after the script has loaded.
Configuring without JavaScript
The script tag accepts the whole configuration as data-* attributes, so you can adjust behavior without writing any code:
<script
  src="https://bugdump.com/sdk/latest.js"
  async
  data-api-key="your-api-key"
  data-theme="dark"
  data-bubble-text="Found a bug?"
  data-screen-recording="false"
></script>
Attribute | Equivalent option |
|---|---|
|
|
|
|
|
|
|
|
|
|
|
|
|
|
|
|
|
|
|
|
|
|
|
|
|
|
|
|
|
|
|
|
|
|
|
|
|
|
|
|
|
|
|
|
|
|
Boolean attributes take "true" or "false". data-translations, data-console-filter, and data-network-filter take a JSON string — note that filter callbacks cannot be expressed this way, so use Bugdump.init() if you need a filter function.
What the page actually downloads
The script tag pulls a ~32 KB gzipped entry file. The two heavy capture libraries are separate chunks the SDK fetches only if something needs them — html2canvas when a DOM screenshot is actually taken, and the session replay recorder once the widget has started, on every plan. Set data-session-replay="false" on a page that should not load the recorder.
This matters in one situation: if you self-host or proxy the SDK, copy all three files into the same directory. The entry resolves its chunks relative to its own URL, so serving latest.js alone silently breaks screenshots and session replay while the rest of the widget looks fine. See Widget configuration reference.
3. Send a test report
Load your page, click the floating button, type a description, and send it.
A description is required — submitting an empty one shows a validation message rather than filing a blank report.
Leave the Widget page open in another tab while you do this. Its last step, Check the connection, is waiting for exactly this: the moment a report arrives from the widget it turns green and links to the task the report landed on. It only counts reports the widget itself sent — a task you create by hand in the dashboard will not turn it green — so green means your snippet is genuinely live on your site.
4. Read it
Open your project in the dashboard. The report is there, and so is everything the SDK collected without anyone asking: console logs, network requests, session replay, browser and OS, viewport size, and the page URL.
5. Identify your users (worth one more line)
If your app has logged-in users, call identify() once they authenticate:
bugdump.identify({
  id: user.id,
  email: user.email,
  name: user.name,
});
This is the highest-value line you can add after installation — it turns "some user hit a bug" into "this specific customer hit a bug." See SDK API reference.
Troubleshooting
No button appears. Confirm the script loaded (check the Network tab) and that data-api-key is present and spelled correctly. If you are initializing manually, confirm the call actually runs — a JavaScript error earlier on the page will prevent it, and an inline Bugdump.init() written without the queue stub runs before the async script has defined Bugdump.
The button appears but sending fails. The key is most likely wrong or revoked, or an MCP token (bdm_) was used instead of a widget key (bd_). Check the browser console for the error the SDK logs.
Submissions return 403. If your project has allowed origins configured, the site you are testing from must be in the list — including http://localhost:3000 during development. Allowed origins are step 3 on the project's Widget page. A 403 with REPORT_QUOTA_EXCEEDED or TASK_LIMIT_REACHED is a plan limit instead — see below.
Reports stop arriving. You may have hit a limit. The free plan allows 500 widget reports a month per project and 10 report submissions per minute per project, with a further per-IP limit of 10 per minute. At the monthly limit the panel says "This site is not accepting feedback right now. Please try again later." until the count resets on the 1st. The Plan and usage section of the project's Settings page shows current usage.
The widget looks broken inside my app. It shouldn't — the widget renders in a closed Shadow DOM specifically so your CSS cannot reach it. If you see this, please file a report.
Next steps
The widget you just installed also sends your site's uncaught JavaScript errors to the project's Errors page, with no extra setup. See Capturing JavaScript errors automatically to set a release, filter the noise, or turn it off.